Git 本身有 git log 的功能,但显示不是很直观;另外也有一些软件可以做到 git 的可视化,但功能会略显复杂,且界面也不一定美观。本篇通过 Python 代码实现某个文本或代码项目的最近的 git commit 次数的可视化,从而达到追踪项目的历史进度的目的。
主要是使用 git log 命令来获取数据:
git log --since="100 year ago" --pretty=format:"%ad" --date=short 下面通过调用 Guan 软件包实现对以上 git log 数据的处理,网址:https://py.guanjihuan.com。安装方法为(版本要求 >= 0.1.117):
pip install --upgrade guan -i https://pypi.python.org/simple将以下 Python 代码放在某个 Git 仓库中运行,可完成统计并画图:
import guan
# 当前目录所在的 Git 项目中 git commit 次数的每日统计
date_array, commit_count_array = guan.statistics_of_git_commits()
# 获取某个月份的日期
date_array_of_month = guan.get_date_array_of_the_current_month() # 本月
# date_array_of_month = guan.get_date_array_of_the_last_month() # 上个月
# date_array_of_month = guan.get_date_array_of_the_month_before_last() ## 上上个月
# 根据某个月份的日期,对原统计数据的进行处理
new_commit_count_array = guan.fill_zero_data_for_new_dates(old_dates=date_array, new_dates=date_array_of_month, old_data_array = commit_count_array)
# 画图
plt, fig, ax = guan.import_plt_and_start_fig_ax(adjust_bottom=0.28, adjust_left=0.2, labelsize=10, fontfamily='Times New Roman')
plt.xticks(rotation=90) # 旋转横轴刻度标签
guan.plot_without_starting_fig_ax(plt, fig, ax, date_array_of_month, new_commit_count_array, style='o-', xlabel='date', ylabel='commits', fontsize=25)
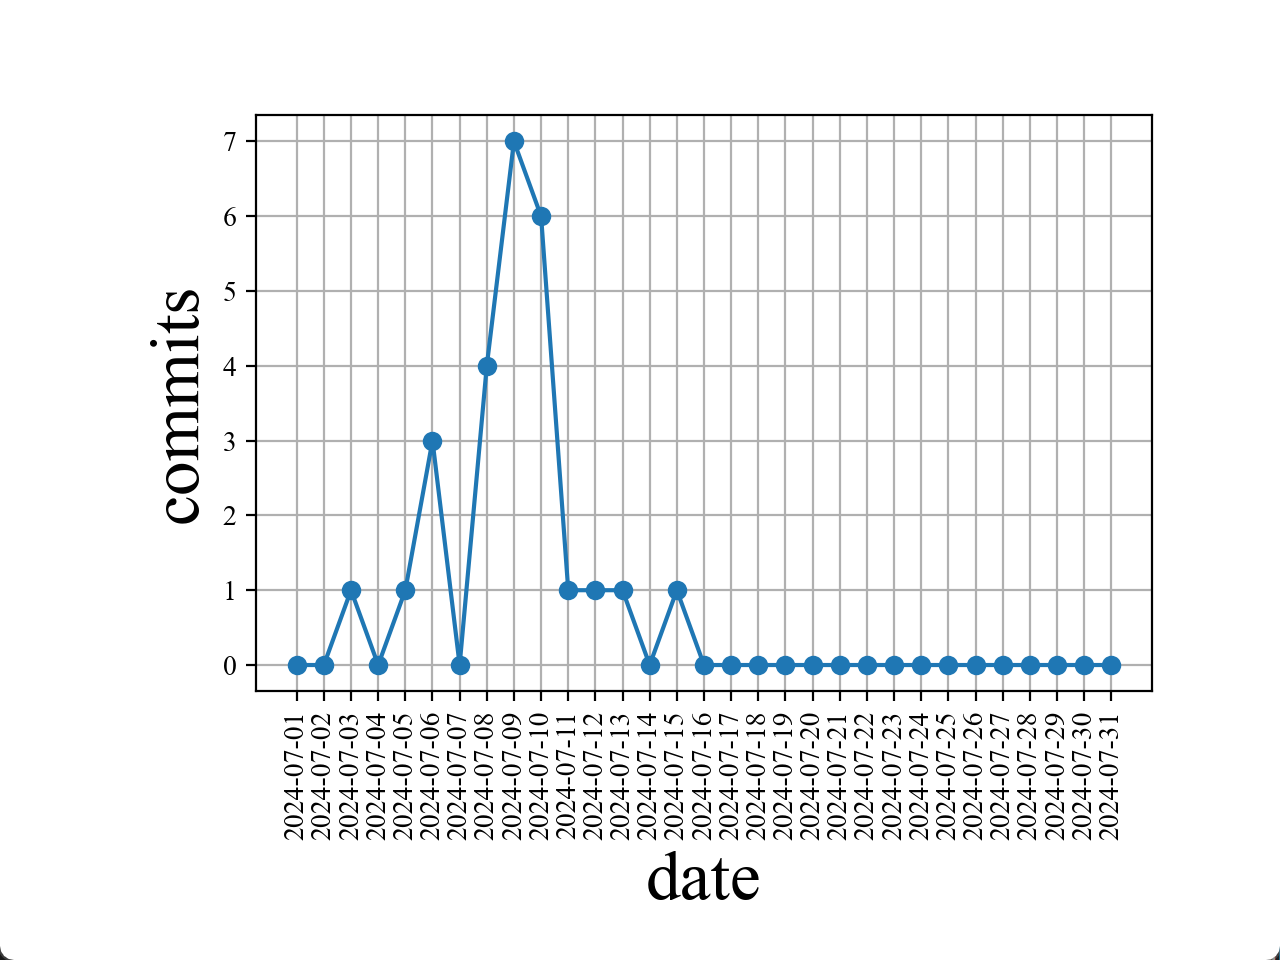
plt.show()运行结果示例:
【说明:本站主要是个人的一些笔记和代码分享,内容可能会不定期修改。为了使全网显示的始终是最新版本,这里的文章未经同意请勿转载。引用请注明出处:https://www.guanjihuan.com】