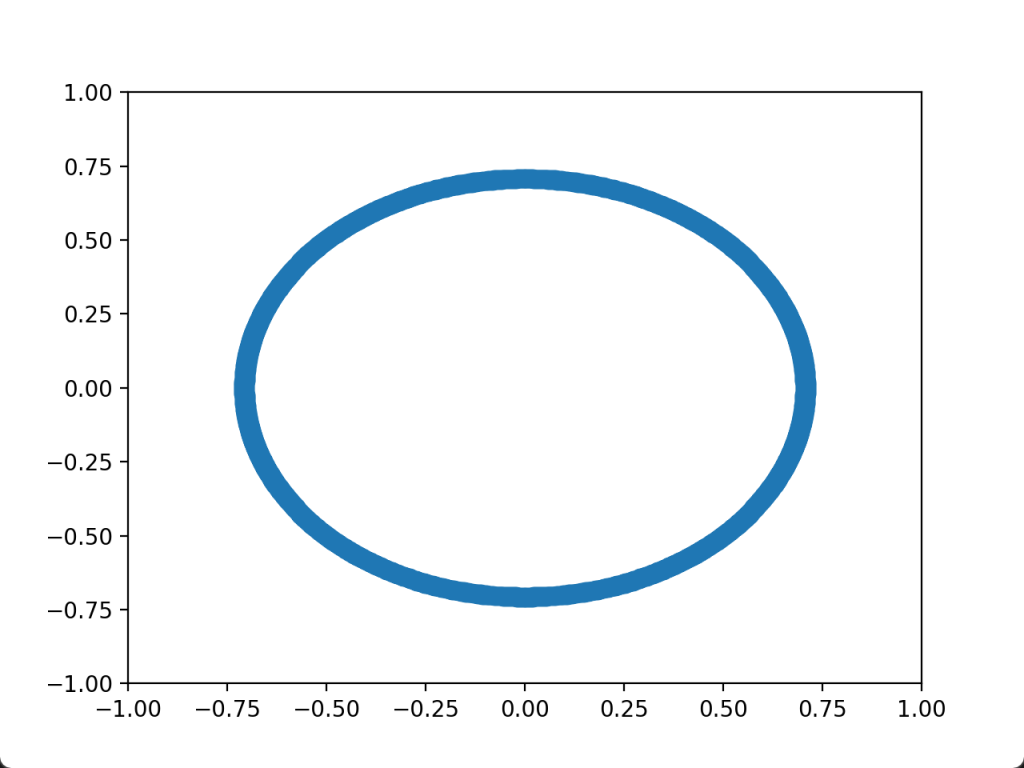
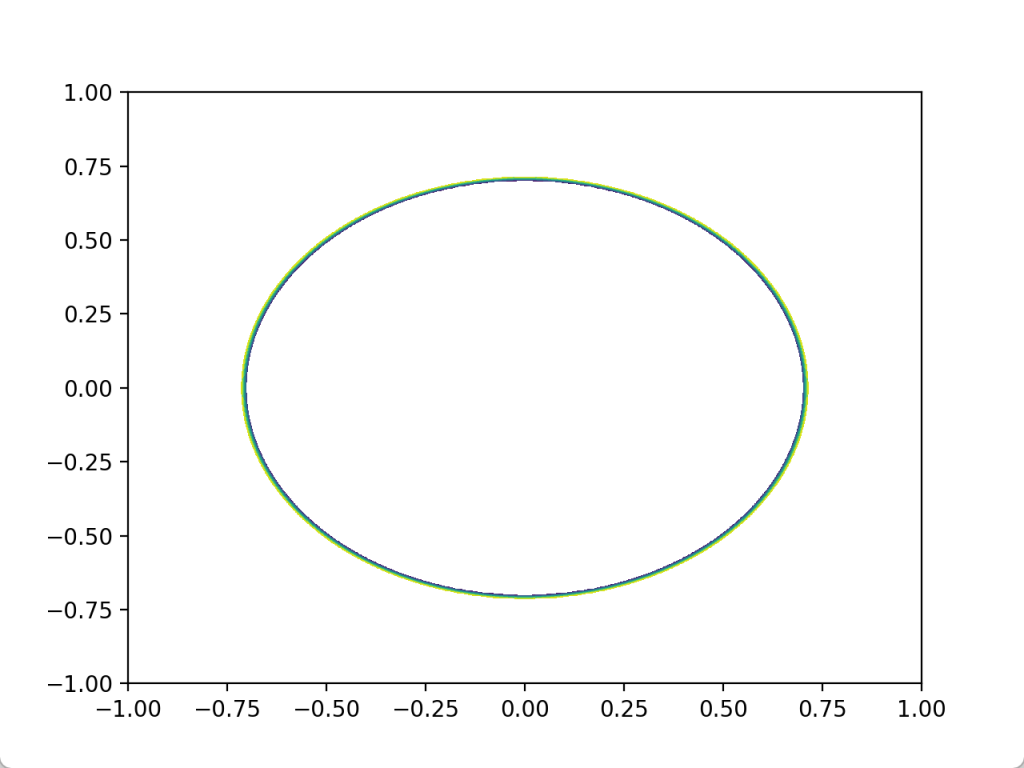
在科研和数据分析中,可能会经常遇到需要画出某个三维图某个特定值的等高线。在Python中,matplotlib库中有contour函数可以画等高线,但好像没有指定特定值的。可能也是有类似的函数,但自己没怎么去查找。
本篇通过单独写的判断代码,画出三维图某个特定值的等高线。
Python代码如下:
"""
This code is supported by the website: https://www.guanjihuan.com
The newest version of this code is on the web page: https://www.guanjihuan.com/archives/29155
"""

import numpy as np
import matplotlib.pyplot as plt

def get_data(x_array, y_array):
    z_matrix = np.zeros((y_array.shape[0], x_array.shape[0]))
    j0 = -1
    for x in x_array:
        j0 += 1
        i0 = -1
        for y in y_array:
            i0 += 1
            z_matrix[i0, j0] = x**2+y**2
    return z_matrix

x_array = np.linspace(-1, 1, 1000)
y_array = x_array
z_matrix = get_data(x_array, y_array)  # 举例的数据

fix_value = 0.5  # 画这个值附近的等高线
precision = 0.01 # 选取该值附近的范围

# 方法一
x_array_new = []
y_array_new = []
for i0 in range(y_array.shape[0]):
    for j0 in range(x_array.shape[0]):
        if abs(z_matrix[i0, j0]-fix_value)<precision:
            x_array_new.append(x_array[j0])
            y_array_new.append(y_array[i0])
fig, ax = plt.subplots()
plt.plot(x_array_new, y_array_new, 'o')
ax.set_xlim(min(x_array), max(x_array))
ax.set_ylim(min(y_array), max(y_array))
plt.show()

# 方法二
for i0 in range(y_array.shape[0]):
    for j0 in range(x_array.shape[0]):
        if abs(z_matrix[i0, j0]-fix_value)>precision:
            z_matrix[i0, j0] = None
fig, ax = plt.subplots()
ax.contourf(x_array,y_array,z_matrix)
plt.show()
运行结果:


【说明:本站主要是个人的一些笔记和代码分享,内容可能会不定期修改。为了使全网显示的始终是最新版本,这里的文章未经同意请勿转载。引用请注明出处:https://www.guanjihuan.com】